Continuous collection
Know how your infrastructure behaves, not just what’s in it
Mugato continuously builds a living record of your infrastructure at minute granularity, every process, connection and dependency, enabling multi-dimensional analysis, before-and-after change tracking and evidence-based decision-making.
Minute
24/7
0
“Most tools out there are using agents. With Mugato, you don't need to do anything. Just install the collector on a server, create a user and you can start collecting information.”
Stop making decisions on stale information
Capture every change
Continuous collection means your infrastructure view is always current, not a snapshot from days or weeks ago.
Root cause in minutes
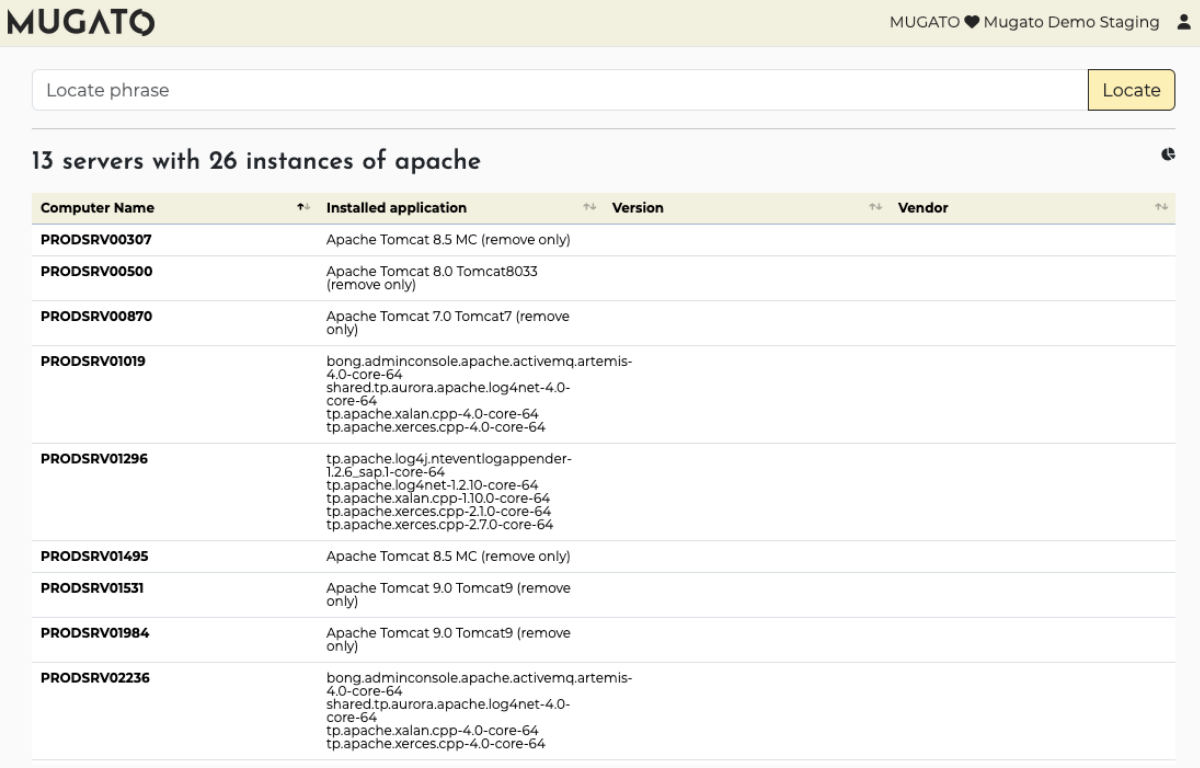
See what’s actually running behind every connection, not just port numbers. Find multiple services sharing the same host.
Audit-ready history
Every data point preserved at minute-level granularity, indefinitely. Compare any Tuesday to the previous Tuesday instantly.
See what changes WITH MUGATO
Mugato continuously builds a living record of your infrastructure at minute granularity, every connection, process and resource metric, enabling multi-dimensional analysis,before-and-after change tracking and evidence-based decision-making.
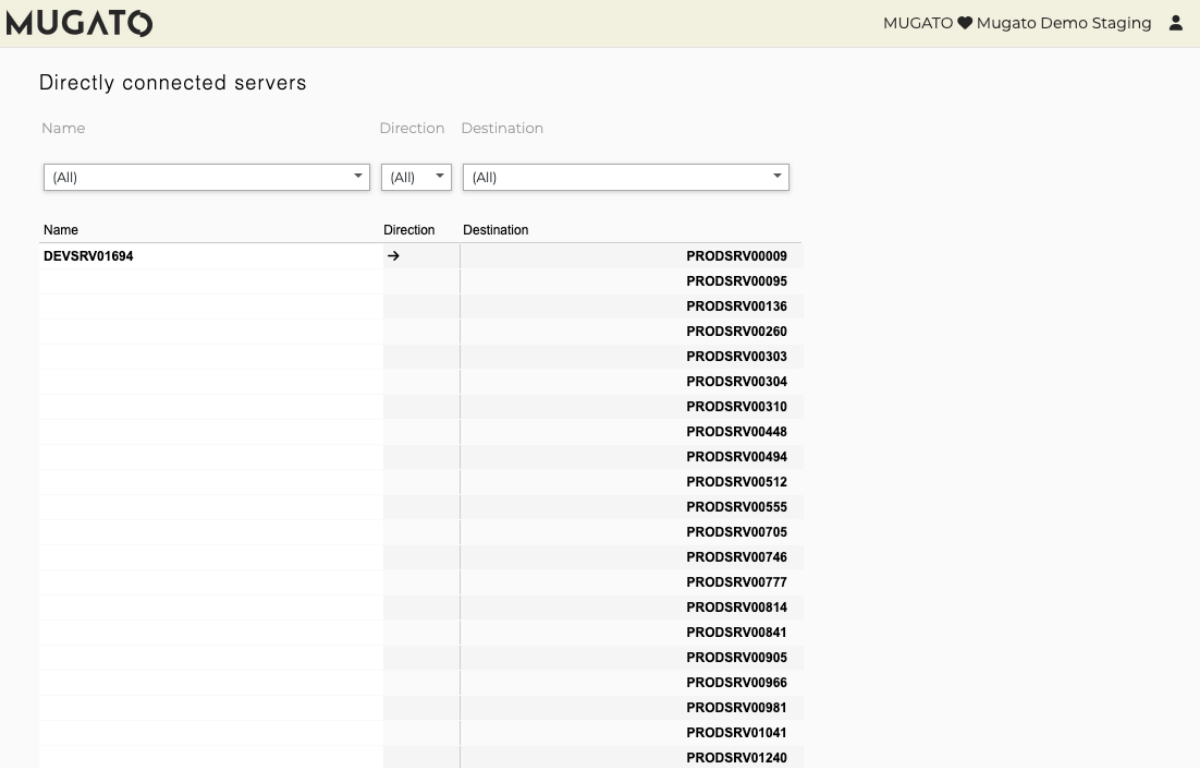
Know instantly when connections appear, change or disappear
Mugato captures every connection between every monitored system, including ephemeral servers that exist for only hours. New, changed and dropped connections are detected automatically, so you never miss a change that could affect production.

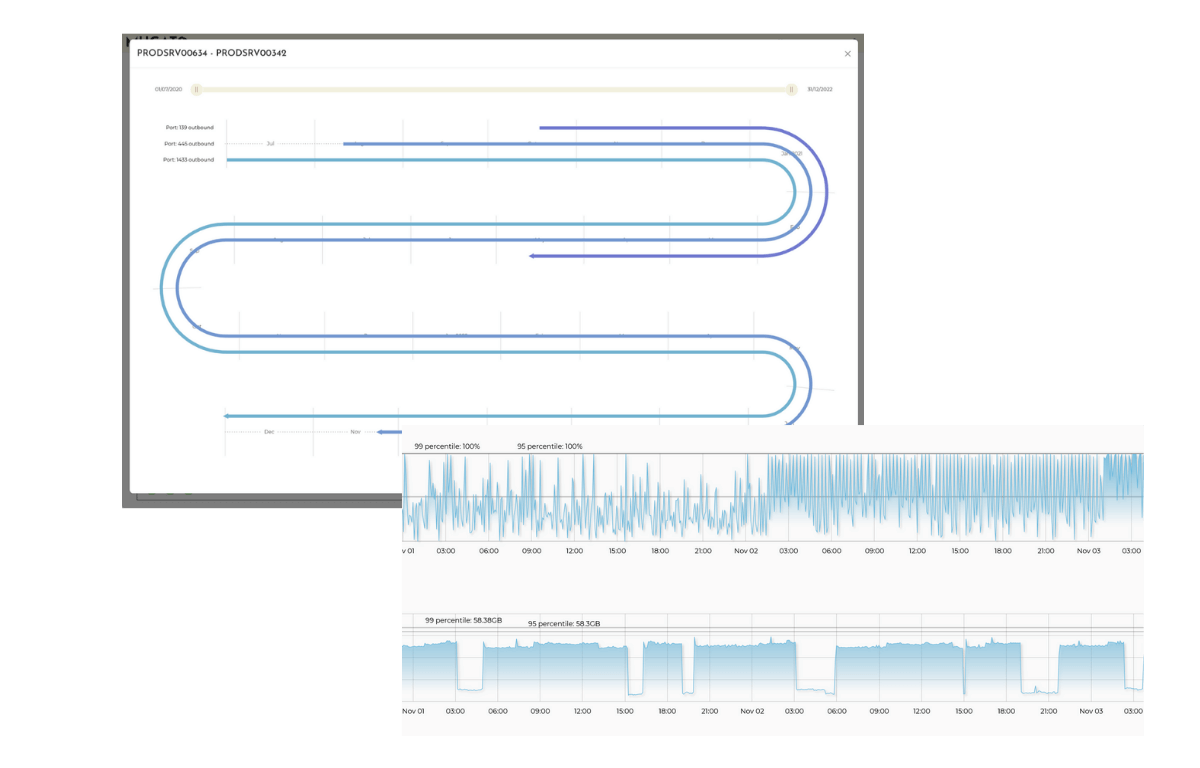
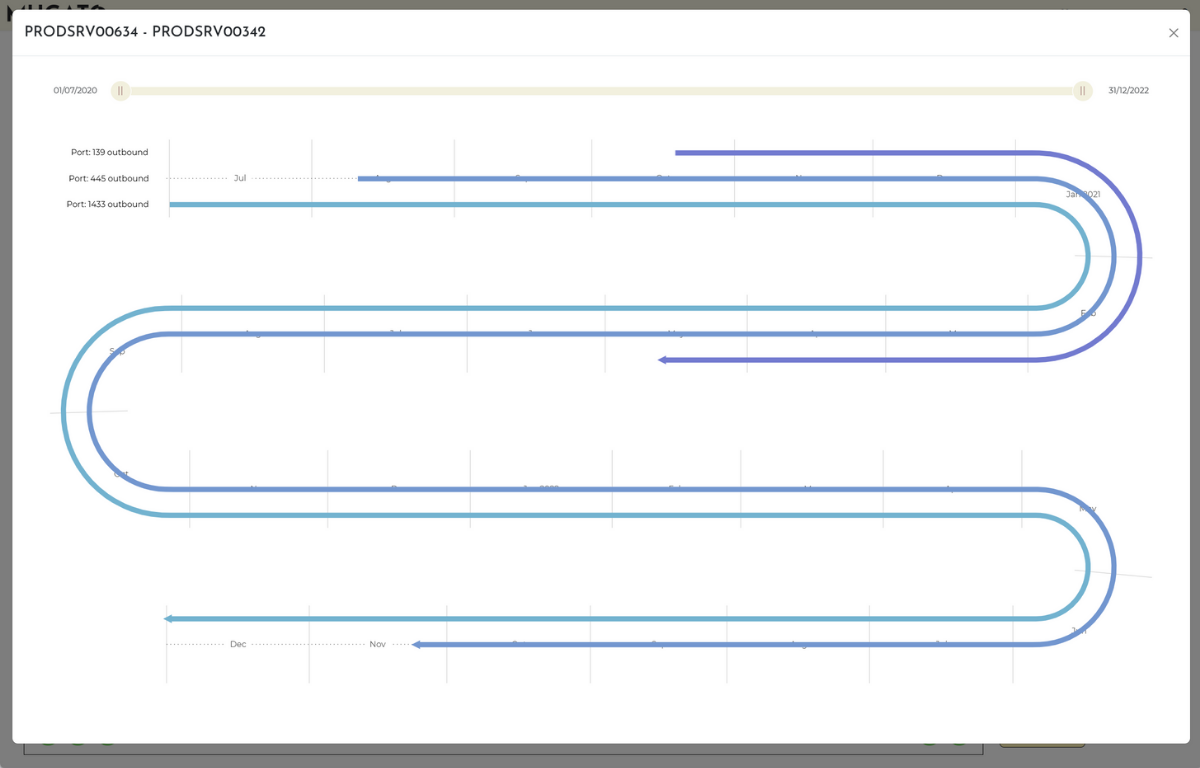
Know exactly which application owns each connection
Mugato goes beyond port-level visibility to identify the actual process behind every connection. Not just “port 443 is open” but which specific process is listening, how it relates to the broader application service and how much compute resource it consumes.
Answer “what changed?” in seconds, not hours
Most platforms delete or aggregate historical meta-information to save storage. Mugato preserves every data point at its original granularity, creating a temporal dataset that lets you move back and forth in time, turning hours of forensic investigation into seconds.
Continuous security intelligence, not a one-time scan
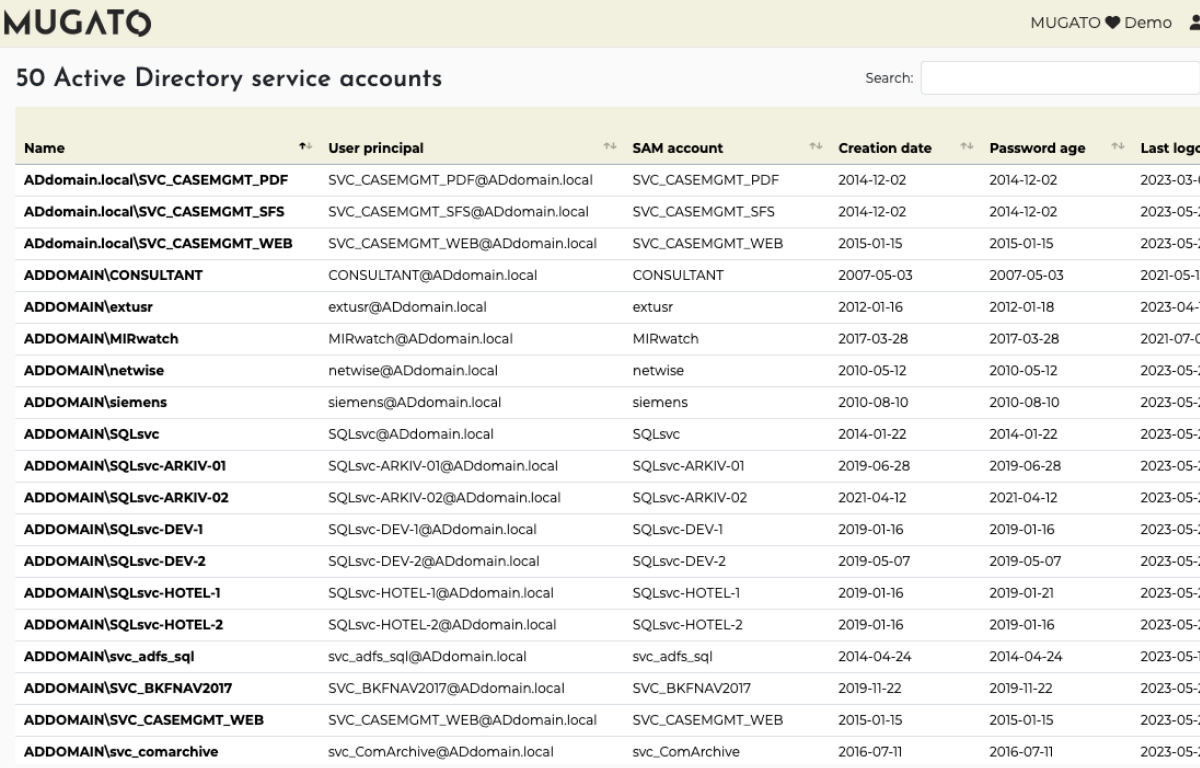
As Mugato collects, it continuously builds a security picture: which service accounts exist, where they’re used, which are shared across environments and which have passwords that haven’t been rotated. This is living meta-information, updated with every collection cycle.
The difference between knowing & guessing
Point-in-time discovery tools show you what existed once. Continuous collection shows you what’s happening and what changed since you last looked.

detect changes instantly
Mugato surfaces changes, such as new connections, dropped processes and shifted resource loads within minutes.
full temporal record
Every data point preserved at minute-level granularity, indefinitely. Compare last Tuesday’s infrastructure state to this Tuesday’s in seconds.
verify change windows
Did that maintenance window fix the problem? Scrub back in time to the exact minute and compare before and after states with certainty.
catch drift before it escalates
Configuration drift, unauthorized changes and gradual resource exhaustion are visible long before they trigger an incident.
never stale, never estimated
Every metric is an observed reading, not an extrapolation or aggregated average, ensuring your infrastructure view is always current.
Audit-ready history
Get the evidence trail compliance teams need, who connected to what, when and for how long, without any additional tooling.
HOW IT WORKS
Install collector
Deploy the Mugato Collector on a single server in your infrastructure. No libraries required.
Continuous collection
The collector runs 24/7, capturing every connection and process. No meta-information is ever deleted.
Temporal enrichment
Every data point is stored at minute-level granularity, building a complete temporal record.
Always-on intelligence
Your infrastructure view updates continuously. Changes are detected in near-real-time.
MUGATO'S UNIQUE continuous collection

features
mugato
OTHER SYSTEMS


ONE PLATFORM, FOUR WAYS TO WORK
Stop reconciling conflicting data from disconnected tools. One live data set, accessible to every team, through every workflow. One source of truth, every time.

Mugato Platform
Interactive dependency maps surface critical relationships, risks and optimization opportunities. Find affected and root cause in clicks and quickly compare any two points in time.

Direct SQL
Connect Power BI, Excel, Tableau or Python directly to the full data set. Build custom dashboards, automate recurring analysis, and enable self-service answers to any business question.

Integrations
Enrich tools like ServiceNow CMDB, LeanIX and Ardoq with live, validated meta-information. Automatic sync eliminates manual reconciliation and keeps your systems aligned.

Natural Language
Open up infrastructure intelligence to everyone—no SQL skills required. Ask questions in plain English via Mugato's MCP server, hosted in your dedicated backend.
FAQ
Ready to get your LIVING it blueprint?
Stay ahead with Mugato: get product updates, event invites, expert insights on IT infrastructure discovery and more. Or let us show you how Mugato can map your entire IT landscape without a single agent.